Execution and Results
The tab labeled Plots lets a user assign values to the model parameters parameters and initial conditions to be used for a simulation, as well as visualize the results, both in graphical and tabular format.
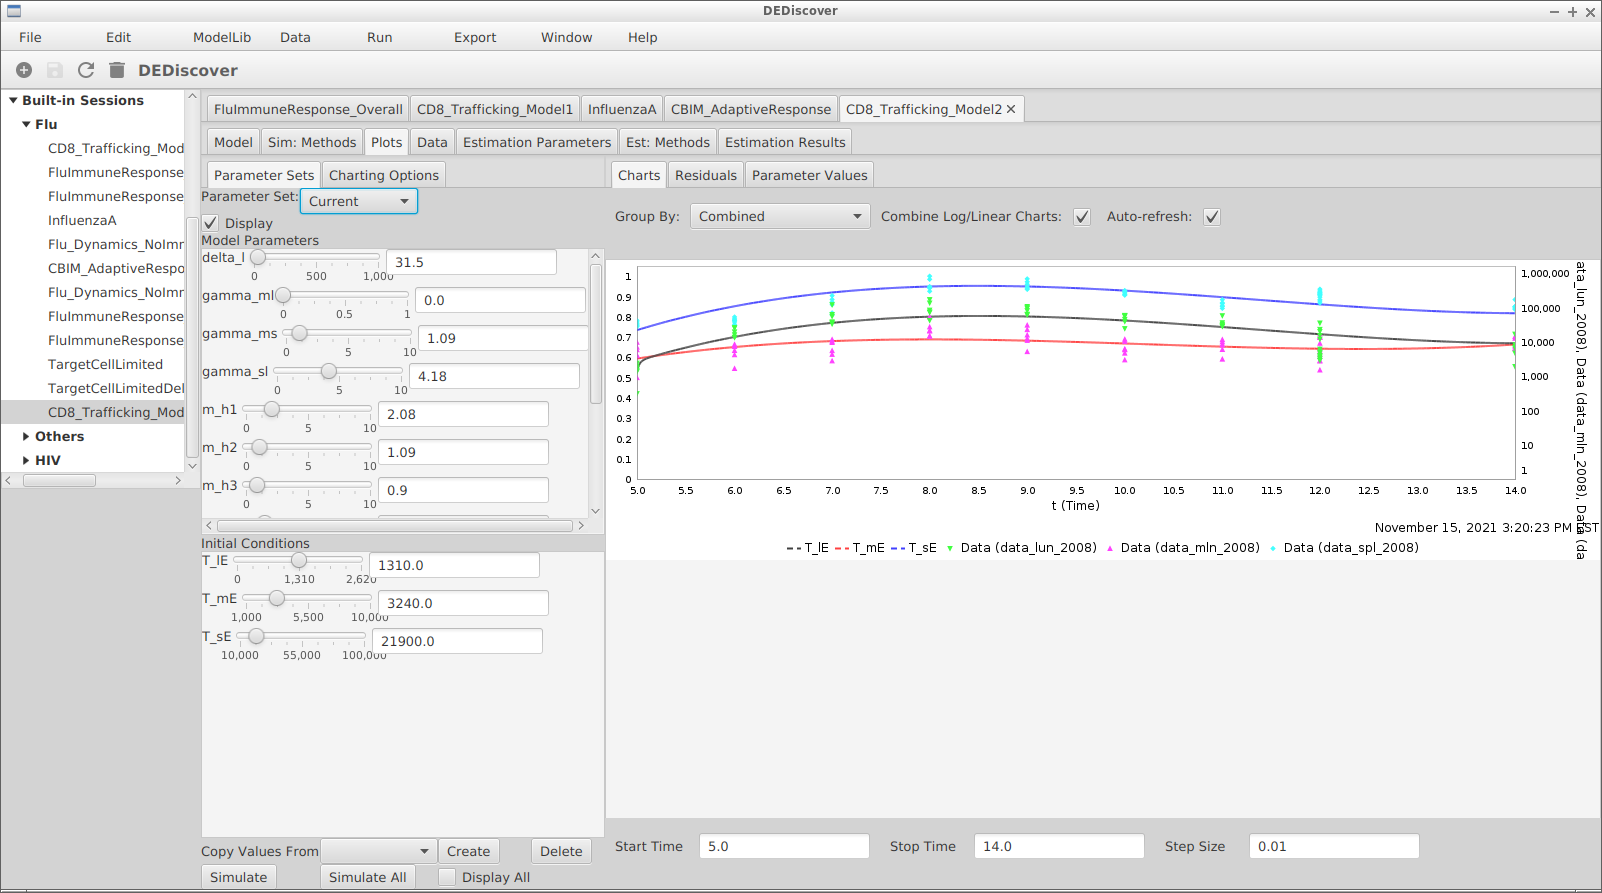
On the left-hand side the user can use the slider to adjust the initial values of the dependent variables, as well as the values of the model parameters. Clicking on the Charting Options sub-tab allows a user to select which variable are displayed, and whether a logarithmic scale should be used. The residuals and parameter values subtabs have not yet been implemented. In the right-hand side a user can display the results with
Parameter Sets
A Parameter Set refers to all the model parameters and initial conditions (the values of the dependent variables at the beginning of the simulation) together with a value, an upper bound and a lower bound. A parameter set is assigned a unique name. Every session in DEDiscover originally contains a parameter set named default and one named Estimation Results. The default parameter set reflects the values that are on the right-hand side of the model tab the first time the model is parsed.
A user can create a new parameter set by clicking on the Create button at the bottom of the window. All the values will initially be set to those of the parameter set currently displayed. A parameter set can deleted with the Delete button.
Once a parameter set has been created in can be used for the simulation, or to initialize the parameter values when performing an estimation. Multiple parameter sets can be displayed at the same time in the result section, allowing for instance to visualize the influence of a single parameter in the model.
Displaying the Results
On the right-hand side the results of the simulation are displayed. The user can choose between graphical and tabular display. In the graphical case there are options to combine or separate the parameter sets and dependent variables, as well as to plot a variable vs another variable. Data from the datatable can also be displayed based on the mappings defined in the the datatable tab.
Automatic update of values
By default the simulations are executed as soon as any value changes, whether it is the parameter values or the start and stop times and the step size under the plots. This can be disabled by unchecking the Auto-refresh box above the simulation results.