Data, Mapping and Covariates
The data tab handles user-supplied data. This data can be used for two different purposes:
- Provides data to fit the model parameters and/or initial conditions when performing parameter estimation.
- Supply data to compute covariates used in the the model.
Consider the model in the following new session that contains 3 covariates at lines 6-8:
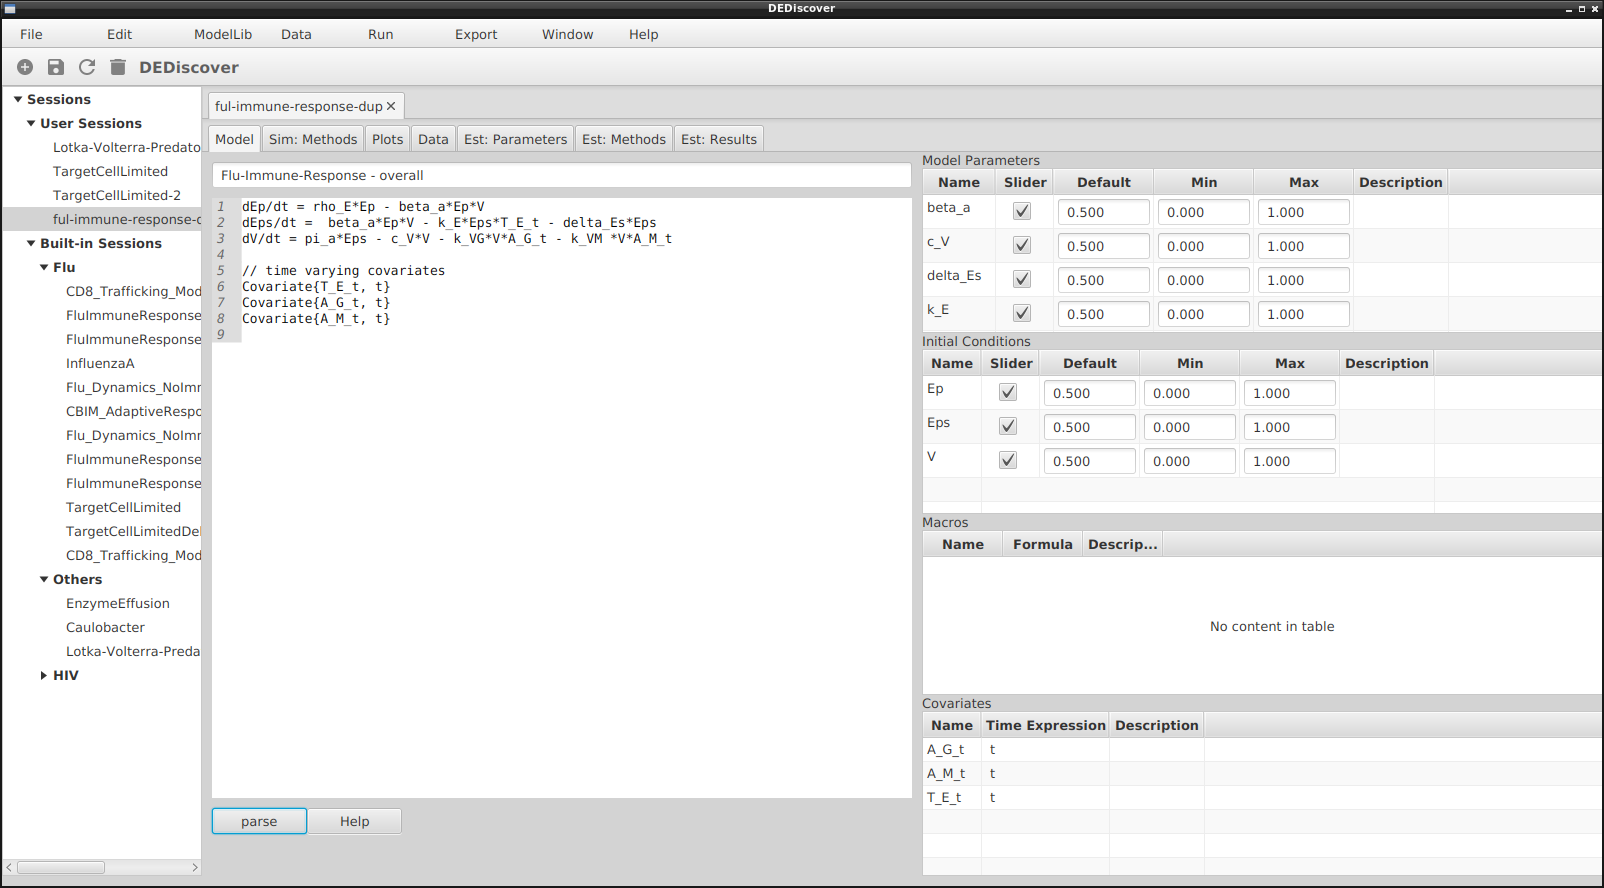
New session with 3 covariates
Before any data is entered, the data tab will look as follows:
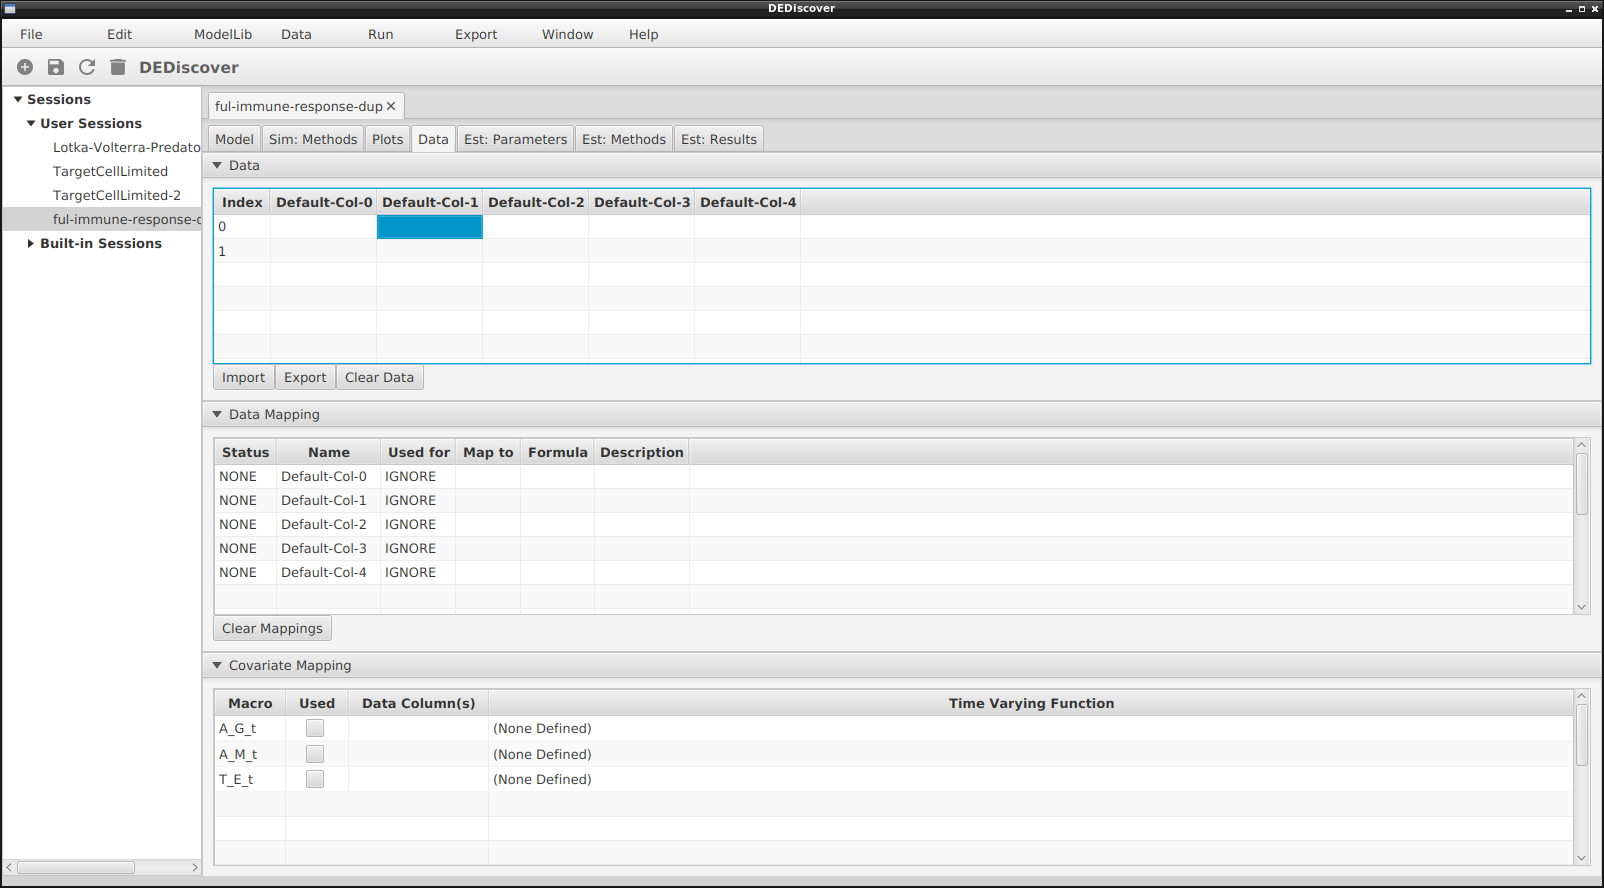
Initial data tab for model with 3 covariates.
The table has two rows and 5 columns with default column names. A user can enter data manually. There will always be two empty rows at the bottom that can not be removed.
The middle table has one row for each column in the datatable. By default they are all ignored. The table at the bottom is where we will establish a mapping between the covariates and the data in the datatable. There is a row for each covariate.
The figure below provides shows the tab after data has been imported:
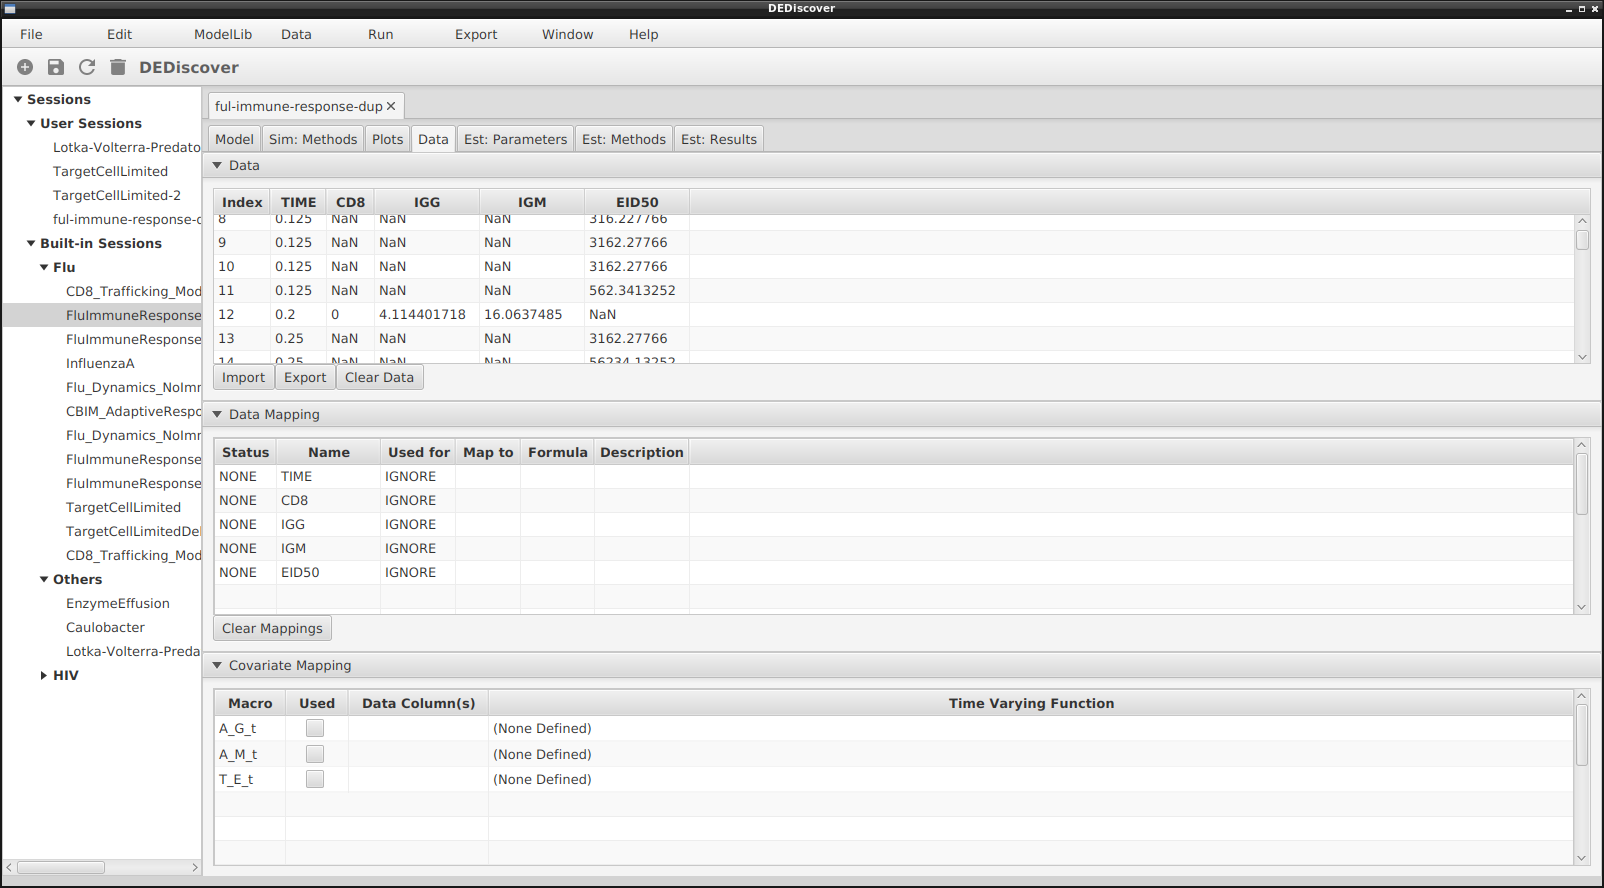
Data tab after loading or entering data
We notice that the the values in the Name column have been replaced with the column names in the newly imported datatable.
Data table description
The data itself is in the top section the window. In a new session there will be two rows where data can be entered manually and 5 generic columns. The datatable interface is somewhat clunky as a result of using JavaFX, or the programmer’s lack of understanding and unwillingness to spend more time on it. For instance clicking the tab key after entering a value will not result in the value being saved. The Enter key must be pressed.
The leftmost column indicates the line number and can not be changed. Then every column contains a header which can be modified by the user. All the header names must be different. The data can be entered directly or imported as a comma separated file, which can contain a header row. (A header row is one that is at the top of the file and contains one fewer column than the other rows.) Rows can be empty. Some sample datatables are provided with the source code.
There is some basic functionality provided for the data table, including the possibility to modify individual values, or deleting rows and columns. But for the time being the easiest way to modify the data is to export it, apply the modifications using a spreadshhet software or a text editor, then reimport it.
Mapping
The middle section of the tab is called the mapping, and indicates what the data represents and how it is to be used on a column-by-column basis. Each column in the data table will generate one row in the mapping table, with the Name column in the mapping table denoting the header in the corresponding column in the data table.
The Used For column can take one of 5 values, as described below:
Ignore
This column will not be used for anything.Time
This column will contain the time value for the data in a row. Only one column can be a Time column. It can contain duplicate values, and any row not containing a valid double value in the Time column will result in the whole row being ignored in any computation involving the data table. The time values don’t need to be sorted.
- Estimation
- This column will be used when performing parameter estimation.
Plot Only
The data in this column can be plotted in the Plots tab, but will not be used for the computation. Note that in this case there must be a valid mapping (see below).Covariate
This option does not appear in the selection list in the column, but will be set if a user selects this column in the Covariate section at the bottom of the tab.
The Map To column is active only when the Used For column is set to either Estimation or Plot Only. It describes how a column maps to the computed values of the dependent variables in the model. The mapping can either be Formula, where the formula is the mathematical expression entered in the Formula column, or any one of the dependent variables or macros defined in the model. The formula is a mathematical equation that can involve one or many dependent variables, macros, constant symbols, functions, in fact anything that is legal for an expression. But usually it will be the sum or average of two or more variables.
The Description column allows a user to add a description or comments related to the mapping.
Covariates
The bottom section of the tab is used for mapping covariates. This section will have contents only if the model contains one or more covariates.
Not all covariates need to be mapped. If there is no mapping, or the Used box is unchecked then the value for the given covariate will be 0 at every time point during a simulation.
For a mapping to be valid a user must select one or more columns from the table by clicking in the Data Column(s) cell in the appropriate row. Then there will be a pop-up window where the data columns can be selected. At this point the Used For value for the column in the mapping table will be set to Covariate and the mapping (if any) will be removed.
The following image shows the popup resulting from clicking in the Data Column(s) cell:
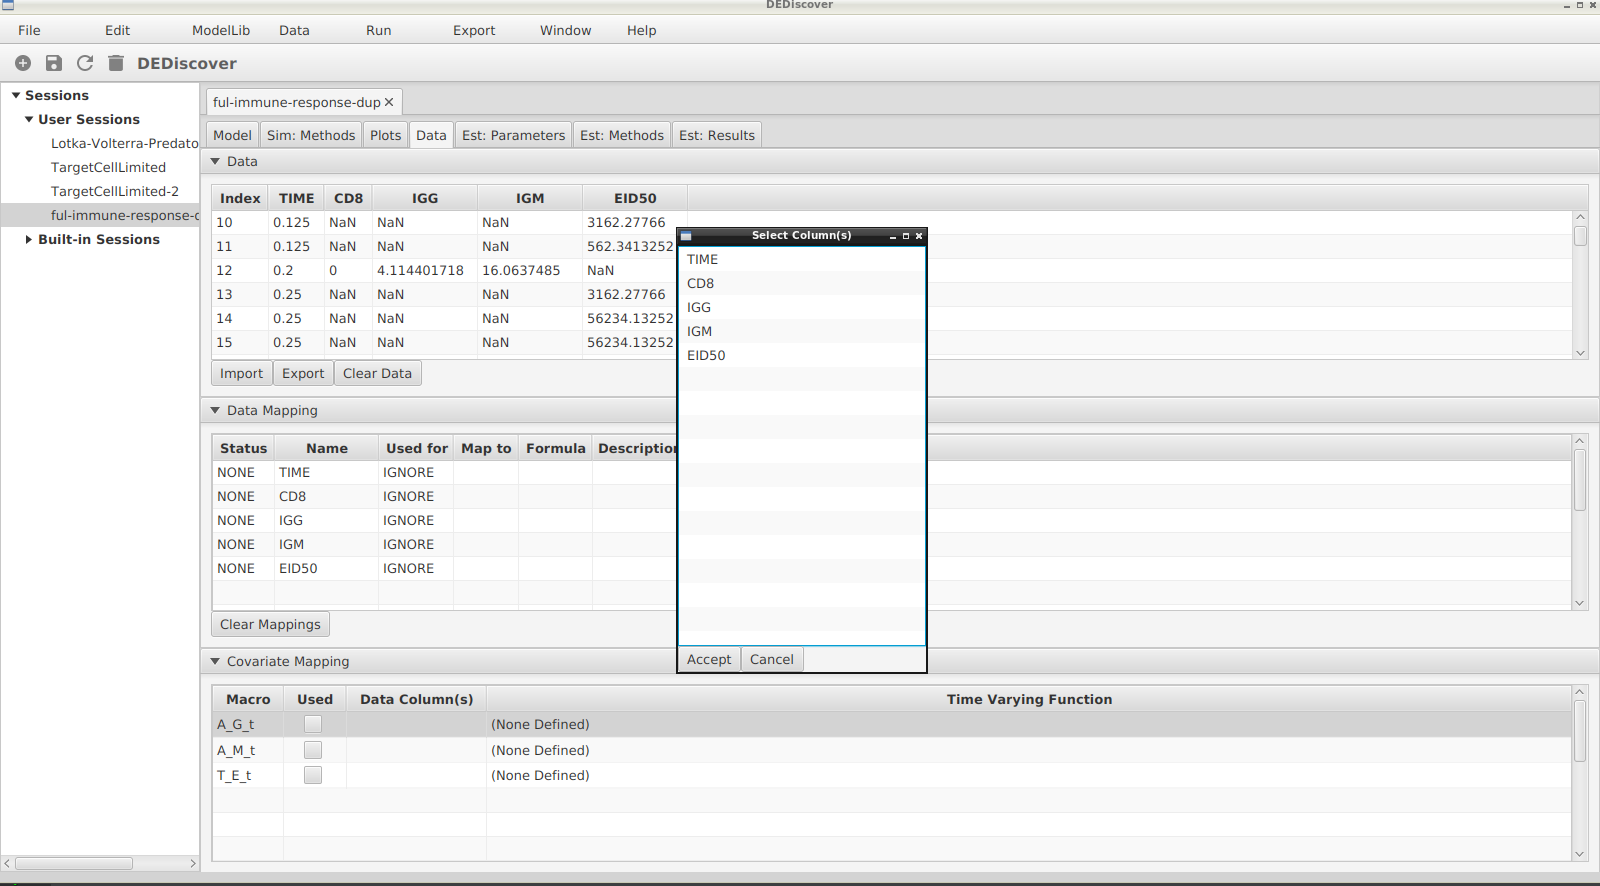
Pop-up to select the data columns
After the columns have been chosen a time-varying function must be selected. There are currently 2 options, which are the same as the functions listed in the model syntax section. Again by clicking in the appropriate cell a pop-up window will allow a user to select and configure the function. The following shows what happens after clicking in the Time Varying Function column.
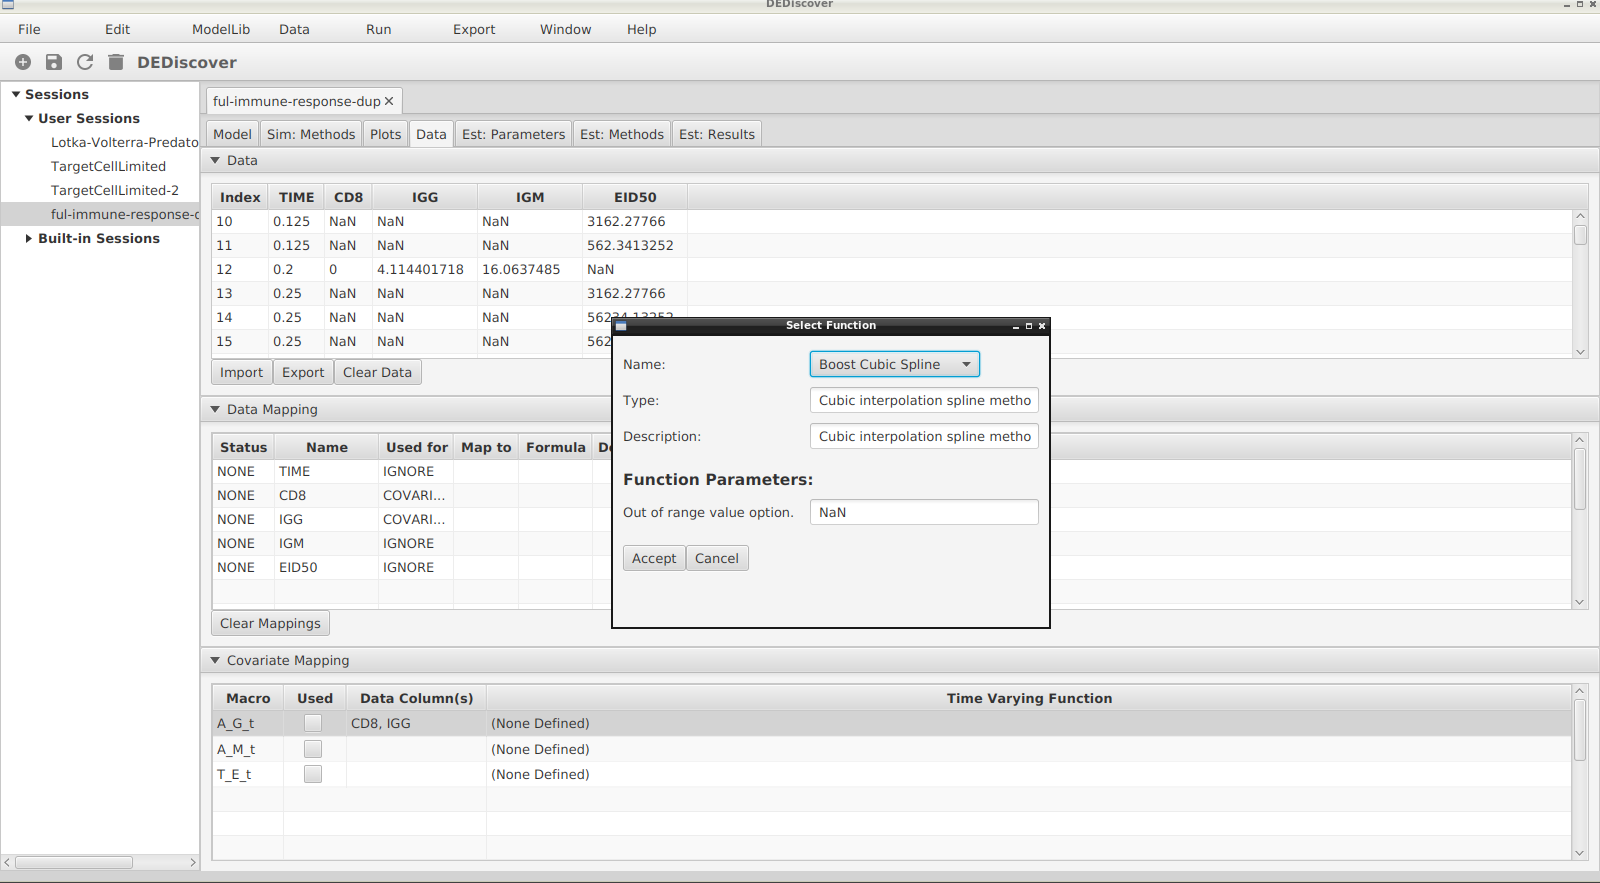
Pop-up to select the Time Varying Function
In the end the windows will look as follows:
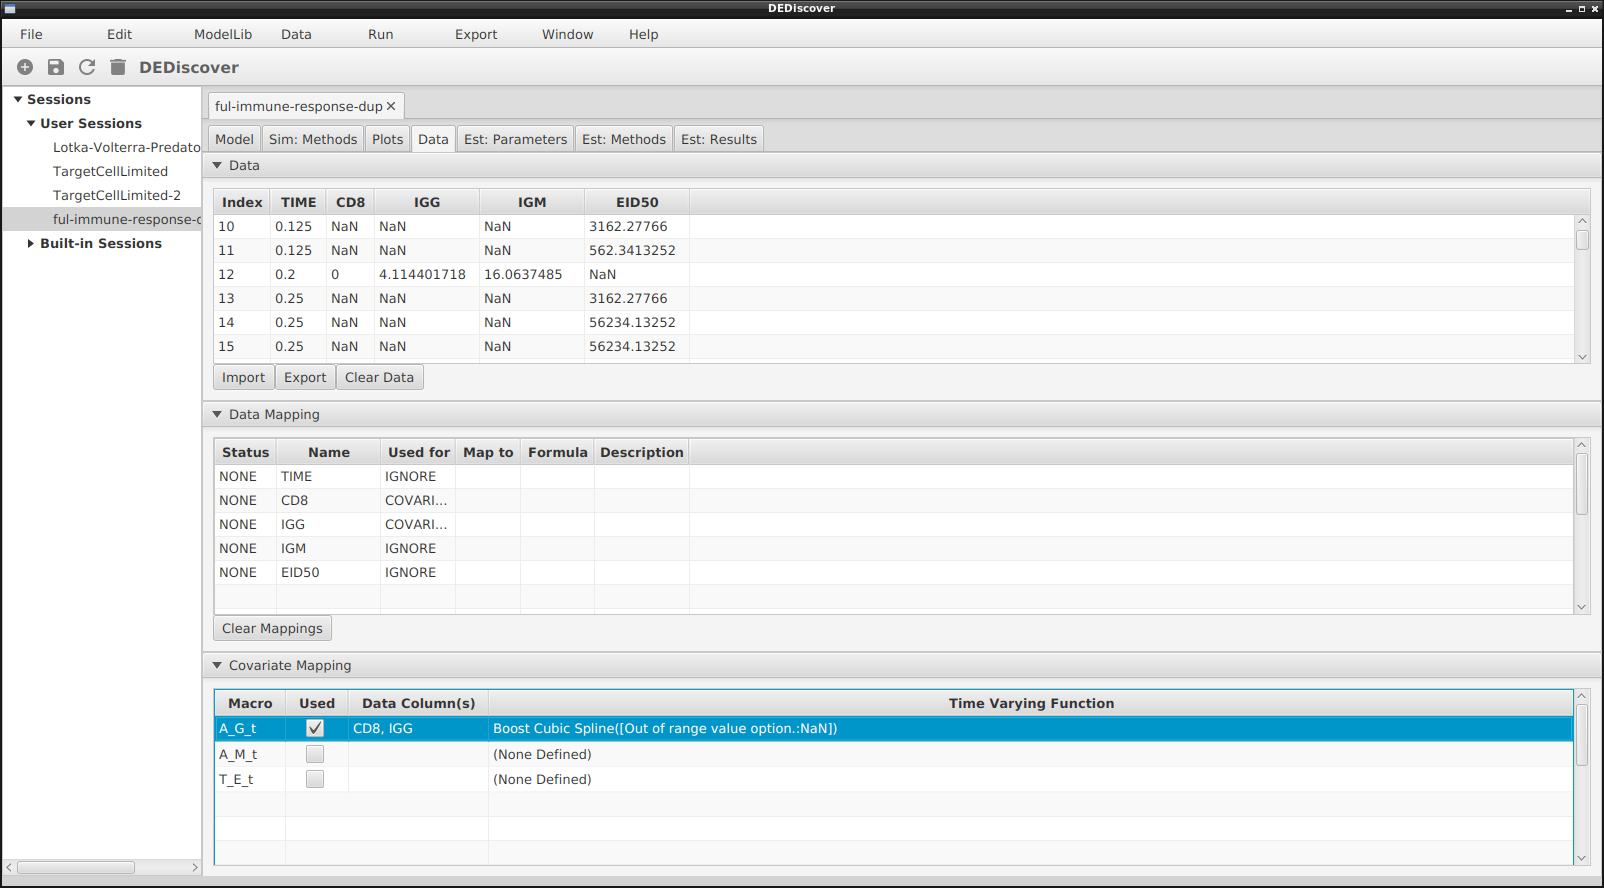
Pop-up to select the Time Varying Function
Note that a column can be used by more than one covariate, and once it is used to map a covariate it can no longer be used for estimation or as the Time column.